Data Manipulation Commands
Append
The Manip > Append & Make Group Variable command works when two or more variables are selected. It appends the case values of the second selected variable to the end of the first. It then appends the third variable’s cases to that, and so on. The result is a single variable containing all the data values of the selected variables, Data. In addition, the command creates a group variable containing, for each case, the name of the variable from which it originally came and names the variable Group. It then creates a new relation to hold these variables and opens it to show them.
If you select two or more y-variables and an equal number of x-variables, the command changes to Parallel Append. Parallel Append appends the first x-variable selected to the end of the first y-variable selected, the second x-variable to the end of the second y-variable, and so on. It creates a Group variable with the group names y and x.
Parallel Append is an ideal tool for appending new data to an existing set of variables. You may have a dataset that has been split into two files or that has come to you as separate files. If the files have different cases but report the same variables, parallel append makes it easy to append the cases from one file onto the end of the cases in the other file.
Split into Variables by Group is the reverse of Append and Make Group Variable.
Duplicate
The {Data} Duplicate command duplicates each selected icon. The copies have the same name as the original icons.
Duplicate performs a smart duplication. Any result icon, such as a derived variable, plot, or table, may use other icons. When an icon that uses others is duplicated, its duplicate uses the same icons as the original did. However, if an icon and the icons it uses are duplicated together, the entire structure is duplicated so that the duplicated result icon uses the corresponding duplicated variable icons.
Patterned Variables
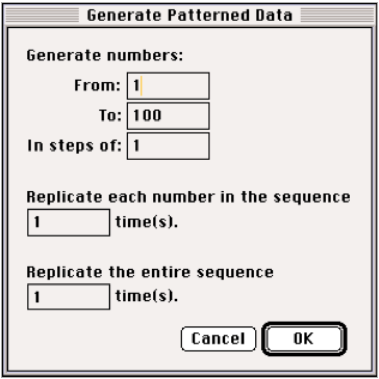
The Manip > Generate Patterned Data… command presents a dialog to specify a sequence of numbers from any number to any number, in steps of a specified size. For example, a sequence from –3 to 9 in steps of 3 is –3, 0, 3, 6, 9. By default it offers the sequence that counts from one up to the number of cases in the frontmost relation, in steps of 1.
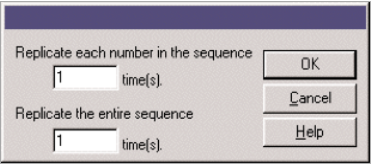
The dialog also offers to repeat each value any number of times and to replicate the sequence any number of times. For our example, repeating each value in the original sequence 3 times generates –3, –3, –3, 0, 0, 0, 3, 3, 3, 6, 6, 6, 9, 9, 9. Repeating the example sequence twice generates –3, 0, 3, 6, 9, –3, 0, 3, 6, 9. Both kinds of replications can be used in the same data generation. (It doesn’t matter which kind of replication is performed first; the resulting sequence is the same.)
Data Desk places newly generated patterned variables in the frontmost relation that has the same number of cases. If it can find no appropriate relation it creates a new one, places its icon in the Data folder, and opens it to show the new variables. If you generate patterned data to use with existing data, but the patterned variable won’t go into the data’s relation, check that you are generating data with the correct number of cases.
Ranking
Many statistics methods (especially nonparametric methods) work with the ranks of the cases in a variable rather than with their numeric values. The rank of a case is the case number of its position in a sorted version of the variable. The lowest valued case has rank 1, the next largest has rank 2, and so on.
To find the ranks of some variables, select them and choose {Manip} Rank. A new variable is created for each variable selected and is named Rank:<varname>.
When two or more values are identical, they are usually given the same rank. The rank assigned is the average rank of all cases with that value. For example, the ranks of 1, 2, 2, and 3 are 1, 2.5, 2.5, and 4, respectively. Except for the fractions that can result from this averaging, rank variables contain integers.
The { Data Desk > Preferences > Manipulation Options} Ranking Options… command, lets you specify how ranking should be performed. Ordinarily, tied values are assigned the average of their ranks, but one option allows them to be ranked in their original order. You can also specify that cases are to be ranked alphabetically rather than numerically.
Repeat Variables
The Repeat Variables… command generates a patterned variable by replicating the cases of an existing variable. This capability might be valuable, for example, to create a factor variable for an experimental design model. Select one or more variables you want to repeat and choose {Manip} Repeat variables…. Specify how you want the new variable to be constructed using the Repeat variables dialog.
The Manip > Replicate Y by X command is helpful for data that come as summary counts by group. It expands the summary counts into a variable that has one case for each individual, to do so, it creates a new variable holding the text string for each case in the y-variable repeated the number of times specified in the x-variable. For example, suppose that you had two variables, each with two cases — one called sex and one called replicates. The variable sex contains the text string “male” in the first case and the text string “female” in the second case. The replicates variable holds the value 3 in the first case and 5 in the second case indicating 3 males and 5 females. If you select sex as y and replicates as x and choose {Manip} Replicate Y by X, Data Desk creates a new variable called sex:replicates, holding 8 cases; 3 cases of “male” followed by 5 cases of “female”.
Sample
To draw a random sample from your data, select the variables from which to sample and choose {Manip} Sample…. The Sample dialog offers several ways to draw samples and allows you to specify the number of samples to draw. Random samples give each case an equal and independent chance of selection. Thus they draw what is formally called a Simple Random Sample.
The sampled cases remain in the same order as they were in the original variables.
Ordinarily, each case can appear only once in a sample. However, clicking the Sample with replacement option gives each case the chance to be selected more than once. When sampling with replacement, each selection is made from the entire set of possible cases (with the specified chance of being selected applied to all cases). Since each draw samples from the full population of cases, any particular case may be selected more than once.
The dialog also offers the alternative of a systematic sample of every i-th case.
Finally, the dialog offers to repeat the sampling any number of times to create many independent samples.
Sorting
To sort a variable, select its icon and choose {Manip} Sort on Y, carry X’s. Data Desk creates a new relation (named for the sort index variable) and places in it a variable holding the same data values reordered with the lowest (most negative or smallest positive) value in the first case and the highest (most positive or least negative) value in the last case and places it’s icon in the new relation.
The new relation also holds a variable of Unsort Indices. These record the case number of each case before sorting.
If you select a y-variable and one or more x-variables, Data Desk makes copies of all of the variables, reordering them in the same order as the corresponding cases of y. The original variables are not changed. When you sort several variables, the y-variable is called the sort key because it determines the new order of the cases in all of the sorted variables.
When cases are equal, Data Desk preserves their original order. Sorting methods with this property are said to be stable. Stable sorting allows you to sort on several sort keys one after the other, last key first. Thus, to sort on year and on month within year, sort first on month and then sort the resulting values on year.
If the sort key has any infinities, they are sorted to the ends of the variable (according to whether they are +∞ or –∞). If the variable has any missing values, they sink to the bottom. Alternatively, missing cases can be omitted entirely from the sorted variables.
The Sorting Options dialog offers three options to control sorting. Choose {Data Desk > Preferences > Manipulation Options} Sorting Options… to show the dialog. Changed settings affect all future Sort commands.
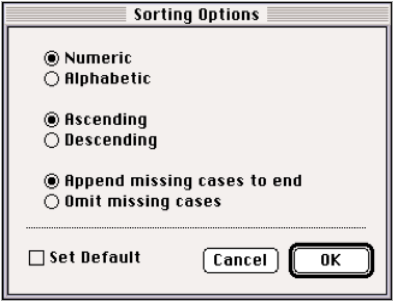
Choose Alphabetic sorting to order cases according to the alphabetic ordering of the text of the sort key variable. You can control the alphabetizing conventions and determine such things as the correct ordering of non-English and accented characters.
Sorting a numeric variable alphabetically reorders the numbers in proper numeric order. Even if the numbers are imbedded in text, numbers are sorted as numbers, not numerals. So, for example, the values aa2zz, aa1zz, aa01zz, aa02zz, aa11zz are sorted correctly as:
aa1zz, aa01zz, aa2zz, aa02zz, aa11zz.
Choose descending ordering to place the highest (largest, most positive) values of the sort key first rather than last. Descending alphabetic ordering places “z” before “y”, and “b” before “a”.
Although the sorted versions of variables deal with the same individuals and have the same number of cases, those cases are in a different order. The sorted variables are thus not in the same relation as the original variables. Data Desk creates a new relation for the sorted data.
Although you can drag the variables back to the original relation (Data Desk would check only that they have the same number of cases), doing so would create an anomalous relationship in which cases were linked incorrectly. You should place sorted and unsorted versions of your data in the same relation only if you are very careful about the operations you then perform.
To sort on multiple keys consult the Data desk documentation.
Split by Group
Manip > Split into Variables by Group is the reverse of Append and Make Group Variable. When a variable holding data values is selected as y and a grouping variable is selected as x, this command creates a separate variable for the data associated with each category in the grouping variable. For example, open the Singers datafile, select Heights as y, Part as x, and choose {Manip} Split into Variables by Group. Data Desk creates four new variables — Alto:Heights, Bass:Heights, Soprano:Heights, and Tenor:Heights. Because each variable holds values for unique subjects, each variable is placed in its own relation.
The Split into Variables by Groups command is helpful for creating variables that can be used with the commands in the Test… and Estimate… menus. These commands analyze and compare data that are in separate variables. If your data are entered in one variable with a second variable holding the category, use the Split into Variables by Groups command to create the required variables.
Split into Variables by Group is also useful to unpack a dataset that may have been formatted (e.g. on an internet site) without delimiters for cases. If you have a single variable that repeats values for each of several variables over and over for each case, you can use Patterned data to generate an index and then Split into Variables by group on that index to make separate variables.
Transpose
The Manip > Transpose command exchanges rows and columns for all selected variables. The cases that were in each selected variable become a row (and thus a case) in these newly created variables. There is one new variable for each case in the selected variables. The effect is the same as transposing a matrix.
To transpose, select one or more variables as x-variables (hold down the Shift key while selecting them) and choose {Manip} Transpose Variables. Data Desk creates new variables, one for each case in the selected variables: case1, case2, and so on. Data Desk also creates a variable named Variables that holds the names of the original variables corresponding to each row of the new transposed variables.
If you have a variable that names cases, you can select that identifying variable as the y-variable and the other variables as x-variables. {Manip} Transpose Variables names the newly created variables with the case identifiers found in the y-variable.
Variable Table
The Manip > Make Variable Table command displays the contents of variables side by side in a spreadsheet-like table. The selector and group variables restrict a variable table to a subset of cases. Using a HotSet selector with a variable table is a powerful way of creating a table that displays information only for those cases that have been highlighted in a plot or selected.
The Use Colors command in the table’s global HyperView menu displays each case in the table in the color with which it is plotted. You can view the colors assigned to each case, but you can’t add or change the color of the cases from a table.