Things on the Desktop
The Data Desk desktop is the ‘playing field’ for all Data Desk operations. It behaves like the desktop on your computer. You can drag icons around, select objects, and work with them. You can make it full screen so it is the only desktop you see or you can resize it to a smaller window. Here are some of the things you’ll find on and around your desktop.
Datafile
The desktop is your view into a datafile. Datafiles store data between work sessions on Data Desk. You can start Data Desk by opening a Data Desk datafile. A datafile holds everything about your work in Data Desk and restores the state of that work when it is opened.
When you quit/exit Data Desk, you can save the entire state of your analysis — including all data and results — in a datafile. Datafiles can be copied to other disks, duplicated, renamed, or discarded.
To open a Data Desk datafile (or a text file), choose {File} Open Datafile…
If you would like to combine the data from an ASCII file or the data and results from an existing Data Desk file, with a currently open datafile, choose {File} Import… Data Desk will open the imported file and place all the data and results into a new folder in the Results folder.
The {File} New Datafile command closes the current datafile and creates a new, empty datafile named Untitled.
Trash
Discard objects by dragging them to the Trash can in the lower right of the desktop. They will remain there until you choose the {Special}Empty Trash command. You can retrieve objects from the trash by opening the trash icon and dragging them back out. The Data Desk Trash icon looks different from the Microsoft Windows® Recycle Bin or the Macintosh Finder’s trash icon. You can discard a Data Desk icon only in the Data Desk Trash. If the Trash doesn’t accept an icon, check that you have dragged the icon to Data Desk’s Trash icon and not the operating system’s trash icon.
File
The File cabinet in the upper right of the desktop holds the highest level of data structure. Within it you may find several kinds of folders:
- The Data folder holds the icons of Relations. Each relation holds variables with data on the same cases. Think of them as data tables with columns holding variables and rows holding information for each case.
- The Results folder stores the icons of all plots, tables, and analyses in the order in which they were created. Because each Data Desk result object can be modified, updated, or used as a template for another analysis, the Results folder provides a more direct record of your work as well as a convenient way to try slightly different alternatives.Double click on any icon in the Results folder to open the analysis or plot.
Any folder can be designated as the Results folder. You may want to have separate Results folders for different analysis paths. To designate a folder as a new Results folder, click the new folder’s icon (or the icon alias in the folder’s window title bar) and choose {Special > Results Log} Assign.
Results in Data Desk can update if the analyses or plots are updated. You may instead wish to keep a complete ‘lab notebook’ style record of everything you have done. The Preserve Results History setting in {Data Desk}Preferences does that. Anytime a result is changed, the old version is saved and a new instance created. This has some consequences for how Data Desk works. Consult the Help or documentation.
- The Derived folder holds any Derived Variables that do not clearly belong to the data Relation from which they were built. For example, a derived variable holding the expression Sum(‘varname’) returns only one value and, therefore, does not fit in the same relation as ‘varname’.
- A Slide folder holds the slide show icons. The order of the slides in the Slide folder determines the order of the slides in the slide show.
- An Action folder holds the icons of Action Programs.
Resizing the Desktop
Click on the box in the lower right corner of the desktop to resize it. If your desktop is in Full Screen mode, press the Escape key to restore the desktop as a window.
Full Screen Mode
The {Data Desk} Enter Full Screen command expands the Data Desk desktop to occupy the full screen. The Data Desk menu bar becomes the only menu bar visible. This gives you the maximum amount of room for your analyses and plots. Press the Escape key or choose {Data Desk} Exit Full Screen to return to the desktop as a window.
Palettes
You should see four palettes on the desktop. The {Modify}Palettes menu toggles their visibility. They are:
- Plot tools, which holds tolls for manipulating and working with displays
- Plot symbols, used to specify the symbols used in any plot that displays individual cases with symbols, as, for example, a Scatterplot or Rotating plot. Select cases and then click on a plot symbol to display the selected cases with that symbol in all plots in that Relation.
- Plot colors, used to specify the colors used in any plot that displays individual cases. Works the same way as Plot symbols
- Selection Modes, controls how the various selection plot tools (lasso, box, pointer, brush, and knife) operate.
Selector Button
A Selector button may be available in the lower left of the screen. Selectors are assigned with the {Special}>Selector submenu. A selector variable is interpreted as holding logical values (0 = False, anything else = True). When a selector is assigned and the selector button is pressed, the next command will operate only on the selected cases. Other commands in the Selector submenu clear the button, locate the selector variable, or substitute another selector variable.
Group Button
A Group button may be available in the lower left of the screen. Groups are assigned with the {Special}>Groupsubmenu. A group variable is interpreted as holding text values that name groups for all cases. When a Group is assigned and the Group button is pressed, the next command will operate on each specified group, producing parallel plots or analyses for each group of cases. Other commands in the Group submenu clear the button, locate the group variable, or substitute another group variable.
Windows
Every plot, table, or analysis displays its results in a window on the Data Desk desktop. Windows work as you expect them to. They look slightly different to remind you that they are special to Data Desk. The Frontmost window has its title bar highlighted. Some operations work only on the frontmost window.
Here are the natural operations for a window:
- Click the box in the upper left to close the window into its icon.
- Click the triangle in the upper left, next to the close box, to drop down the window’s Global Hyperview menu. This menu holds commands that refer to the current window and may offer modifications or suggest additional related plots or analyses.
- The Title bar holds the name of the window. Command-click (Windows Option-click??) to rename the window.
- Click the box in the upper right corner to zoom the window up to full size. Click again to reduce it to the previous size.
- The box next to the zoom box holds the window’s Icon alias. The icon alias can be used just like the window’s icon, to drag the window’s icon wherever you would like. Double-click to locate the window’s icon.
Drag the symbol in the lower left corner of the window to re-size the window.
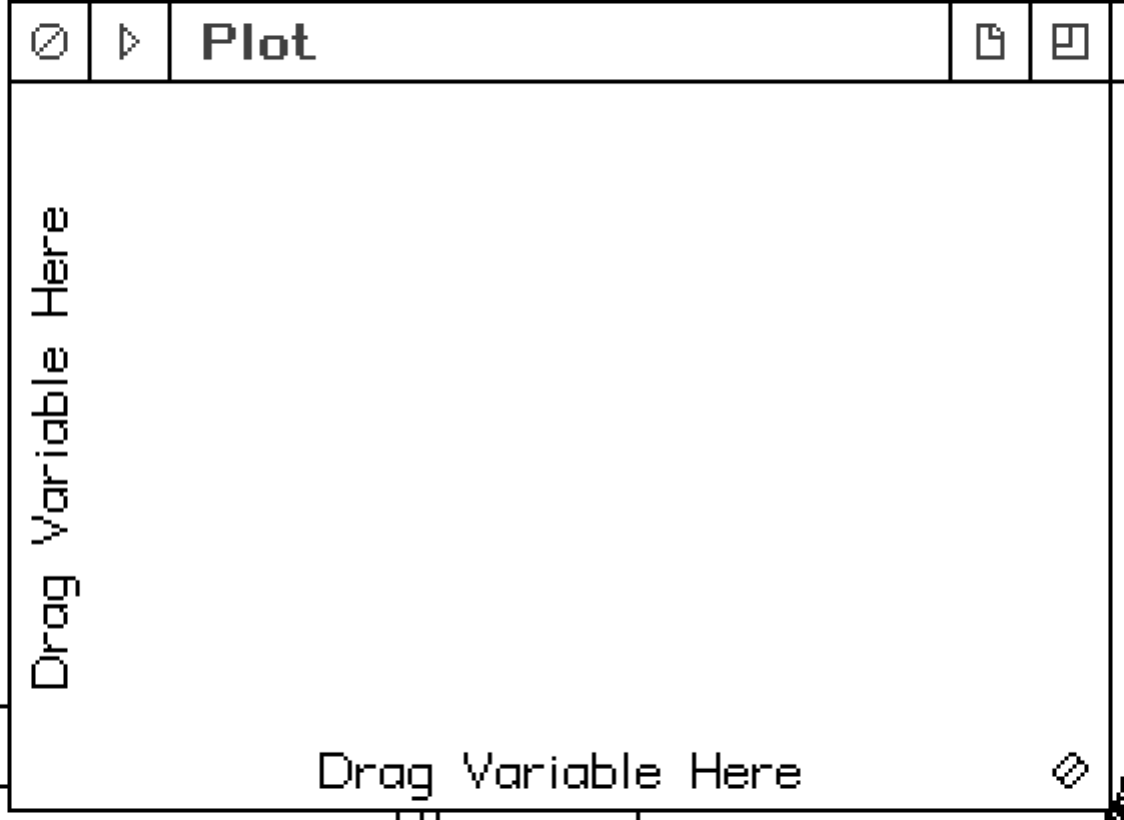
Most windows (such as the one shown here) invite you to drag variables into parts of them to make a plot or perform an analysis.
The {Data}Close command closes the frontmost window.
The {Data}Close All submenu closes all windows of specified types:
- Close All Displays closes all plot windows.
- Close All Variables closes all windows that show the contents of variables.
- Close All Icon Windows closes all windows that hold icons.
- Close All Windows does that.
- Close All Siblings closes all the windows that are siblings of the frontmost window. That is, it closes the chain of windows that have been generated by Hyperview commands from that window and from its siblings.
Icons
Each of the principal objects that Data Desk works with or produces is represented on the desktop by an icon. You can tell what kind of object you have by what its icon looks like.
To do anything with an icon you must first select it by moving the tip of the cursor’s arrow on top of the icon and clicking. Selected icons highlight. To move an icon, click on it and drag. You can move several icons by selecting them all and then dragging any one of them. When you drag an icon to the right or left edge of an icon window, the icons in the window scroll to reveal any additional icons located beyond that edge of the window. The speed of scrolling increases as you get closer to the edge of the window. To avoid scrolling, drag icons off the top or bottom of their windows or drag them rapidly across the right or left edge. This feature makes it easier to manage windows with many icons. We recommend that you use folders to group icons logically when there are many icons in a window.
You may place icons on the Data Desk desktop, but it is usually more convenient to leave them in the windows that ordinarily hold them.
Icons provide a convenient place to put away data, plots, and analyses so that they don’t clutter the screen but are still readily available. Whenever you close a window it will close into an icon. Whenever you open an icon, it will open into a window. To open an icon, select it and choose Open from the Data menu, or double-click on it.
When an icon is open to show its window, the icon appears shaded. Shaded icons are still active; you can move them, discard them, and use them as you would any other icon.
To rename an icon, click on its current name and edit it as you would any text. Pressing the Tab key selects the name of the next icon to the right in the same window. When you tab off the right edge of the icon’s window, the icons scroll to stay in view.
— (Data > New) —
The {Data} New submenu creates new objects on the desktop. The available objects are the following:
Folders
Folders hold other icons. Folders may hold other folders. Selecting or dragging and dropping a folder is the same as operating on all of the icons it contains.
When using a small number of variables, you may want to arrange them in a single icon window and select them as needed. For more complex analyses or larger collections of data, it is better to organize variables into groups so that you can deal with them easily.
Several icons may belong together because they describe the same individuals or circumstances, because they contain related quantities, because you plan to use them together in an analysis, or because you want to group them to clean up the Data Desk desktop. In Data Desk, icons can be grouped into folders for any of these reasons.
Folders keep the desktop uncluttered by providing a convenient way to group collections of icons. You may collect any icons, whatever the reason for grouping them, into a folder. Moreover, folders can contain other folders. For example, a folder of economic indicators might include a smaller folder of energy-related variables along with general variables like GNP.
Data Desk’s folders keep icons in a strict left-to-right order. It is always clear which item is the first (the leftmost), which is the second, and so on. This order can be important to the statistics and display operations in Data Desk. So a second reason for using folders is to keep variables in a particular order.
Folders also provide a convenient way to manipulate groups of variables. They can simplify advanced analyses by providing a way to group variables. When you select a folder’s icon, Data Desk selects all the icons it contains in left-to-right order. To create a new folder choose the {Data > New} Folder command and provide a name. Typing CtrlN (f N on Mac) creates a new folder as well. The new folder is added to the frontmost icon window on the right.
If there are too many icons to fit in the window, its scroll bar across the bottom can move them left and right. If you drag a selection rectangle off the side of a folder, the icons automatically scroll away from you and continue the selection. You can drag the icons to new positions in the window, on the desktop, or to other folders.
Icons dragged into the icon of a folder are appended to the right of the icons in the folder. The folder icon highlights when the dragged icon is over it. Release the mouse button to drop the dragged icons into the folder. You can drop icons into a closed folder icon or into the shaded icon of an open folder.
Relations
Most datasets are rectangular. There are variables (usually represented as columns) and cases (usually represented as rows). Each case has a value recorded for each variable. The recorded value may be a value defined as ‘missing’ rather than a number or a category name. Because each case has a value for each variable and each variable has a value at each case, the array of data can be shown as a rectangular table of values.
Data analyses typically relate two or more variables to each other. However, the variables must hold data for the same cases in the same order. If a variable recording median education in each of the 50 states was arranged in alphabetical order, it would make no sense to plot it against a variable holding median income in each state that was ordered from west to east, or against a variable that recorded income by region rather than by the state.
This rectangular structure is known in database theory as a relation, and Data Desk adopts this terminology. Formally, each row in a relation must be unique. Accordingly, Data Desk assigns a unique case number to each row in order from top to bottom. If your dataset is a standard rectangular data table, calling it a relation changes nothing. However, if your data include variables recorded for several relations, you will find that Data Desk’s relational data management abilities let you structure, enter, and work with your data in more natural ways.
For most datasets, Data Desk uses relations to make your life easier automatically. For example, if your data form a simple relation, Data Desk automatically keeps cases aligned in your variables. Thus, if you cut a case out of one variable, Data Desk offers to delete that case from all variables in the relation to preserve your ability to analyze the variables together.
Most analyses that deal with more than one variable make sense only when the variables are in the same relation. You cannot combine variables from two different relations in the same plot or calculation, but Data Desk provides ways to refer from one relation to another so that the resulting variables are properly matched.
Data Desk can deal with multiple relations. Relational operators in Derived Variables operage across relations.
Data Desk takes great care to preserve relations and to insist that variables that work together belong to the same relation. For example, all variables in a relation must have the same number of cases.
You can drag variables between relations if they have the appropriate number of cases, but it is your responsibility to be sure that this makes sense that is that a variable dragged into a new relation actually refers to the same cases in the same order as the other variables in that relation.
Operations such as {Manip}Split into Variables by Group create new relations because, almost by definition, each group defines a separate relation.
Variables
A variable contains data. A typical variable might have numbers recording measurements or observations about some individuals, organized as a column of values. Variables often hold numbers, but they can also hold text or a mixture of numbers and text. To see the contents of a variable, open its icon. The variable opens into a window displaying its contents, and the icon of the variable is shaded to indicate that the variable is open. You can enter new data or alter the data in the window.
The icon for a variable looks like a column of values. Ordinarily, you can leave variables closed and work with the icons. After all, statistics is about the relationships among the variables not about calculations on the numbers, so you rarely need to see the numbers themselves. By leaving the variables closed, you can keep your screen much less cluttered.
Each variable has a name. You may use almost any name you can type, including names with punctuation marks, spaces, and numbers. For example, ‘Wages&Tips’, ‘123’, and ‘{random values}’ are all legal variable names. Variable names can have any number of characters, but it is a good idea to choose short evocative names. If a variable name is too long to fit neatly under its icon on the desktop, the name is abbreviated. Click the abbreviated name to see the full name. Because abbreviated names show the initial characters, it is wise to make those the most identifiable parts of the name. Thus ‘response1’, ‘response2’, and ‘response3’ will look the same when abbreviated, making it hard to tell them apart.
To change the name of a variable (or of any icon) click on the name to select it and type the new name. Press the Tab key to advance to the next icon and rename it as well. To create a new variable choose {Data > New} Blank Variable.
Most Data Desk commands are specified by dragging the icons of variables into appropriate places in the windows for the plot or analysis. All can also be specified by first selecting variables and then choosing commands. A few commands require this method of specification.
Another (faster, more advanced) method of specifying commands in Data Desk is to first select variable icons and then choose the command. When you select a variable, its icon highlights and it is branded with a ‘Y’
To select a second and third variable, hold down the Shift key and click their icons in turn. They will highlight with ‘X’ brands. Alternatively, if variables are adjacent in a window, you can point to one side of them, hold the mouse button down, and drag the mouse across the variables. An outline box will follow the mouse. When you release the mouse button, all icons covered by the box are selected. (It is important to start dragging while the tip of the mouse arrow points to the side of a variable. Otherwise, if the arrow touches a variable icon, you will select that variable and drag it with you.) You may select icons from several different windows.
Y highlighted variables play a special role for some commands in Data Desk. For example, they are the dependent or predicted variables in a regression and the y-axis in a scatterplot. Typically, the first variable you select is a y-variable and subsequently selected variables are x-variables. You can explicitly select a y-variable at any time by holding down the Option key on Mac, or the Ctrl key on Windows, while selecting the variable. The mouse cursor changes to Y to indicate y-selection. Similarly, holding the Shift key while selecting variables changes the cursor to X to indicate x-selection. Both of these cursors select with the point of the arrow rather than with the middle of the cursor.
To change an already selected icon from y-highlighting to x-highlighting, Shift-click the icon. To change to y-highlighting, Ctrl-click on Windows (Option-click on Mac). To de-select an icon hold down both the Shift and Ctrl (Option on Mac) keys and click it.
When you drag across several variables, they are selected in left-to-right order, so the first will be the one on the left, even if you drag from right to left.
You will see several kinds of variables. Any of them can be used in the same way by dragging it into a window or selecting it as an argument.
Blank Variable
The {Data}New > Blank Variable command creates and opens a fresh, empty variable suitable for entering values.
Derived Variable
Derived variables are specified by functions and formulas. Follow the link to see the list of functions. You can type any formula of any complexity you like using variable names (enclosed in single quotes), function names, and ordinary arithmetic operators.
The {Data}Evaluate Derived Variable calculates the values of a derived variable and creates a new ordinary variable with those values.
Hot Result
Hot Results are results that derive from an analysis. They are ‘hot’ in the sense that if the analysis changes, the hot result will immediately update. That will lead to updating any plot or analysis for which the hot result was an argument.
Thus, for example, a hot result holding the residuals from a regression analysis might be displayed with a histogram. If a new predictor is dragged into the regression, or if a value in one of the variables in the regression is corrected, the hotresult will update to the appropriate new value and the histogram will indicate that it needs to be redrawn.
You cannot open a HotResult variable because its values cannot be edited.
Slider
A slider is a graphical control that has a single numeric value. It can be used in any Derived Variable expression, where it reports its value. Sliding the physical slider changes the value dynamically and continuously reports that change to the expression that uses the slider, causing it to update its value.
Scratchpad
A scratchpad is a place where you can type expressions to evaluate. The expressions can include variables. Drag the icon of a variable into a scratchpad to add its name to the expression at the current editing point.
You may want to keep a ScratchPad on the desktop to hold information about a datafile (for example, the original source of the data), or keep one in each relation to describe the data in that relation. ScratchPads are ideal for noting what you did during an analysis and reminding yourself of what you intend to do. They typically hold notes about the data or analysis at large.
ScratchPads provide a temporary editing environment. If you paste the text into a ScratchPad, you then can select and copy numbers from the table easily. Similarly, you can import the entire contents of a text file into a scratchpad. The text file might contain data or could, for example, be a text description of a datafile.
ScratchPads also offer a calculator capability closely related to the calculation abilities of derived variables. Type any expression that would be legal in a derived variable, select it, type Alt = on Windows (command = on Mac), choose Evaluate from the scratchpad’s global HyperView menu, or choose {Data}Evaluate Derived Variable. The results appear in the ScratchPad just below the expression.
Layout
Layout windows provide a way to combine Data Desk windows into a single window. They are a good way to document the progress of an analysis.
Corkboard
Corkboard windows group plots and tables. They are often used to build interfaces for Action Language templates.
Note
Notes are fields in Corkboards in which you can type.
Button
Buttons are placed on corkboards to initiate actions specified with the Action Language.