Boxplots
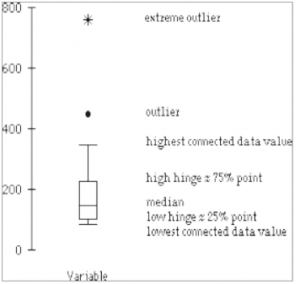
To make a boxplot of one or more variables, click on the boxplot button in the ribbon and drag the variables’ icons into the resulting window.
To make boxplots of one variable for two or more groups defined by another variable, choose the boxplot button in the “By Group” section of the ribbon, drag the variable to be plotted onto the y-axis and the grouping variable onto the x-axis.
