Contingency Tables
To make a contingency table, choose Tabl from the Contingency section of the Ribbon. Then drag a category variable icon onto the caption of the plot according to whether you want that variable to specify rows or columns. Alternatively, select two variables first and then choose the command. You can also drag a variable icon into an existing table on top of the name of the variable you want to replace. To replace both factors, select two new category variables and drag them both into the center of the table. If your data are already tabulated, you can use the Replicate Y by X command from the Manip menu to re-create variables that would result in such a table.
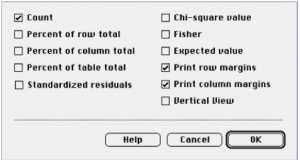
Tables will show any or all of the cell-level values specified. Most are clear. Standardized residuals are the values whose squares are summed to obtain a chi-square value. They allow you to assess the influence of the individual cells on the overall chi-square result.