Re-expressing variables with Sliders
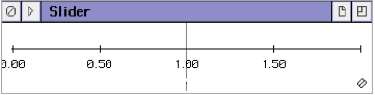
A slider window holds a horizontal axis intersected by a hairline. You can grab the axis with the Hand tool and slide it from side to side. As it slides, it displays the value at which the hairline crosses the axis and publishes it as the value associated with the slider’s name. If that name is used in a derived variable expression, plot, or analysis, they take on a new value whenever the slider is moved. Choose Data > New > Slider.
Use sliders to search for a good re-expression for variables. Select a variable, then choose Manip > Transform > Dynamic > Box – Cox Transformation. Data Desk will create a new slider and a derived variable that uses it. Use the derived variable in your plot or analysis. (Note: you can just drag it into an existing one, dropping it directly over the variable you want to re-express.) Choose Turn on Automatic Update in the window’s global HyperView menu. Now as you slide the slider, you can watch your plot or analysis change dynamically. Plots or related analyses found from HyperView commands will update as well so, for example, you can watch a plot of the residuals from a regression change as you hunt for a re-expression for the response variable. (Try this; it is even cooler than you may think.)